
When done right, infographics and maps remain some of the most effective content marketing examples for presenting complex information in a visually compelling and easy-to-digest format. These formats help brands turn data-driven insights into high-quality content that resonates with their target audience, supports brand awareness, and performs well across channels.
Looking for infographic and map examples that truly stand out? Below are unique campaigns we’ve created for clients. We also highlight what high-performing content assets have in common and how these elements transform data into shareable assets that attract attention from publishers, audiences, and search engines alike.
The Key Elements Behind High-Performing Content
Successful digital marketing campaigns often share the following characteristics:
- A data-driven foundation. High-performing content often starts with original or well-sourced data, turning insights into valuable content that supports in-depth storytelling.
- A clearly defined target audience. Effective campaigns are built around specific personas and demographics, making it easier to create great content that resonates with potential customers.
- Strategic format selection. The best content uses the right formats, such as infographics, maps, or interactive content, based on how the audience consumes information and shares it across platforms.
- High-quality visual execution. Strong infographics and interactive assets prioritize clarity, structure, and flow.
- Built for distribution and sharing. Shareable assets are designed with publishers, journalists, and social media posts in mind.
Infographic and Map Content Marketing Examples
The following infographic and map campaigns highlight how thoughtful design and data-driven insights can resonate with audiences and earn meaningful visibility.
Map Content
Travel delays and setbacks can be enough to make even the most mild-mannered person lose their cool. Particularly, flying can cause elevated levels of stress due to so many people’s infrequent use of this travel method.

Social Shares: 4,433
Notable Features: Yahoo, MSN, Market Watch, Travel and Leisure
By analyzing airport data, flight cancellation numbers, ticket prices, and personal information about flyers and airlines, we created color-coded maps to convey the differences in air travel prices and flight timeliness. This campaign garnered over 4,400 social shares with placements on major publications and within travel verticals.
Pop Culture Infographic Content
Few pop culture icons are as celebrated and reviled as Barbie, especially for her controversial figure. This made her the perfect centerpiece for a campaign aimed at raising awareness about body image issues. We created an infographic comparing Barbie’s unattainable body measurements to the average female body to highlight the unrealistic nature of her body type in the real world.

Social Shares: 55,818
Notable Features: Huffington Post, Ad Week, Fast Company
By combining the nostalgia factor of a well-known pop culture icon with an emotional issue many people face – the pressure to achieve a perfect body – this campaign achieved coverage from global publishers and tens of thousands of social shares.
Relatable Infographic Content
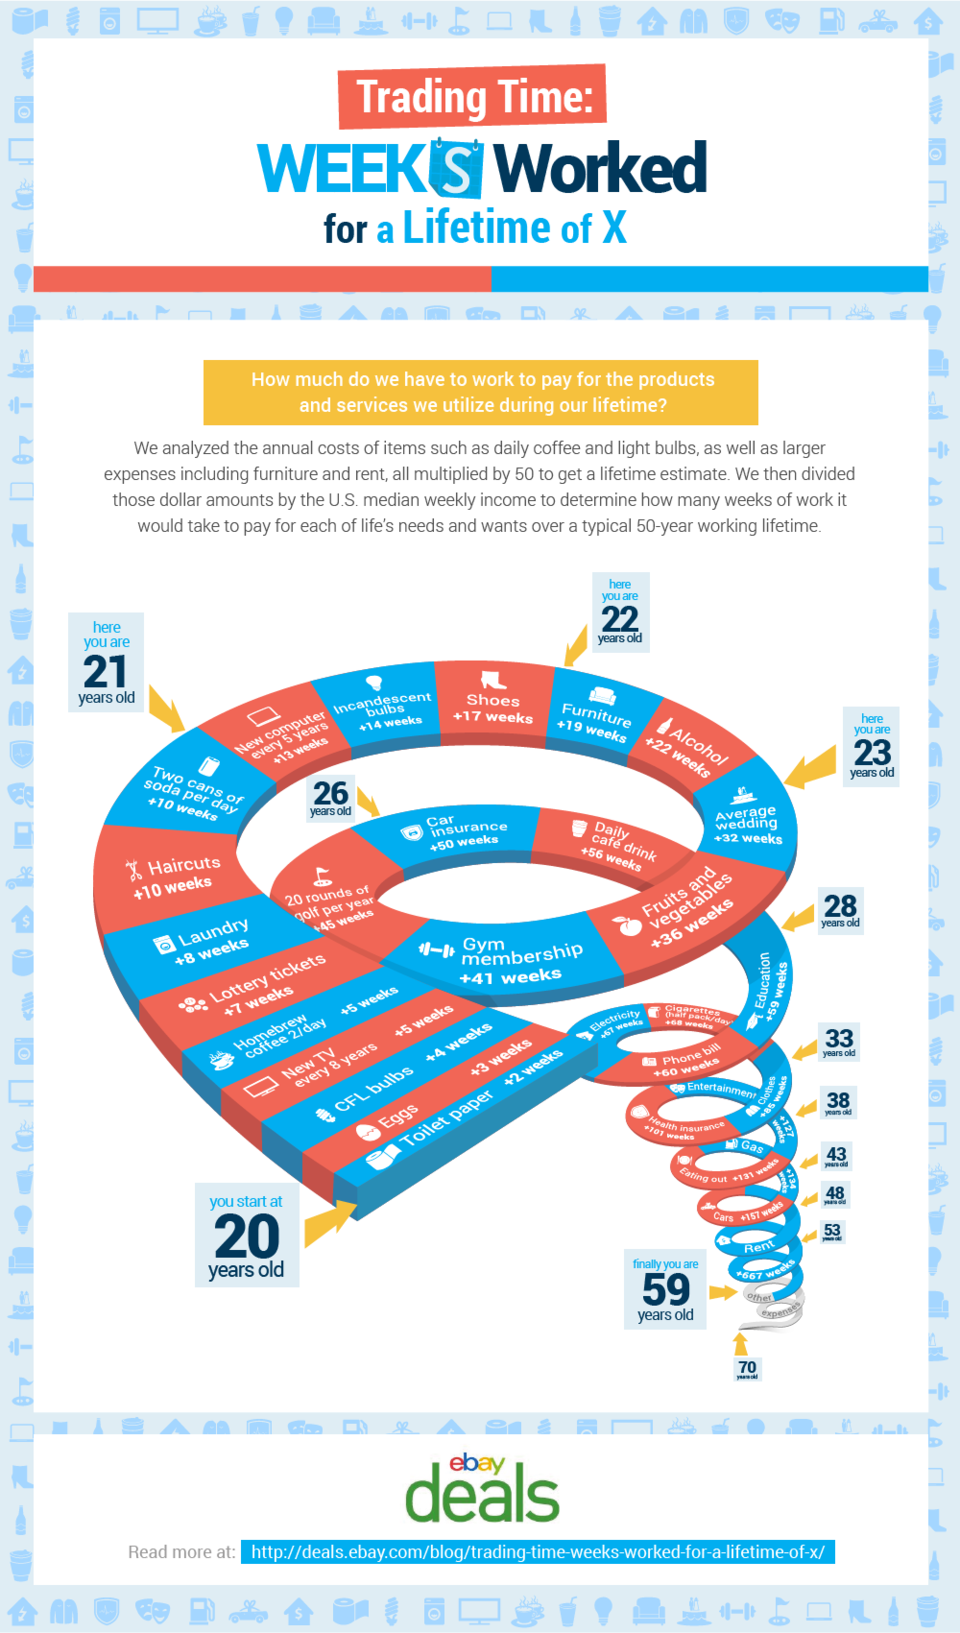
Our Trading Time campaign presented an eye-opening look at how long you would have to work to pay off a lifetime’s worth of expenses ranging from rent to toilet paper. The campaign was a hit with financial publishers and garnered coverage on top sites, including Business Insider and Yahoo Finance.
Social Shares: 490
Notable Features: Business Insider, MSN, SFGate.com, Yahoo Finance, Credit.com
This campaign was a great example of creating multiple content assets using the same data. In addition to an infographic illustrating how much of one’s life is spent paying off expenses, we also created a calculator that allows users to plug in their salary and state to get a personalized look at how much of their salary goes toward different expenses, as well as a flipbook featuring more granular data.
How Brands Repurpose Infographic and Map Campaigns for Greater Reach
To maximize the impact of content marketing strategies, brands often extend a single dataset into multiple content types, increasing visibility, engagement, and long-term value.
Common ways brands repurpose infographic and map campaigns include:
- Interactive content extensions. Infographics and maps are often transformed into interactive tools, such as calculators or quizzes, that allow users to explore data in a personalized way, increasing engagement and time spent on the page.
- Landing page integration. Visual assets are embedded into dedicated landing pages to support storytelling, enhance conversion rates, and guide users toward deeper educational content.
- Social media content adaptations. Key insights are presented in bite-sized visuals for social media posts, making the data more shareable across platforms.
- Educational content formats. Campaign data can be repurposed into tutorials, webinars, or step-by-step guides.
- Email marketing and outreach assets. Infographic and map highlights are reused in email marketing campaigns and media outreach to re-engage existing audiences and attract new publishers.
Bringing Data-Driven Content Marketing to Life
Infographics and maps turn data into clear, engaging stories. As the campaigns above show, high-performing visual content attracts attention and drives valuable engagement, which helps brands earn authoritative coverage and build trust with their target audience.
At Fractl, we help brands create data-driven content marketing campaigns that build brand awareness and support long-term growth.
Browse more of our work to see how strategic research, creative execution, and smart distribution come together to produce content that performs.
Get in touch with our team to explore how we can support your next campaign.