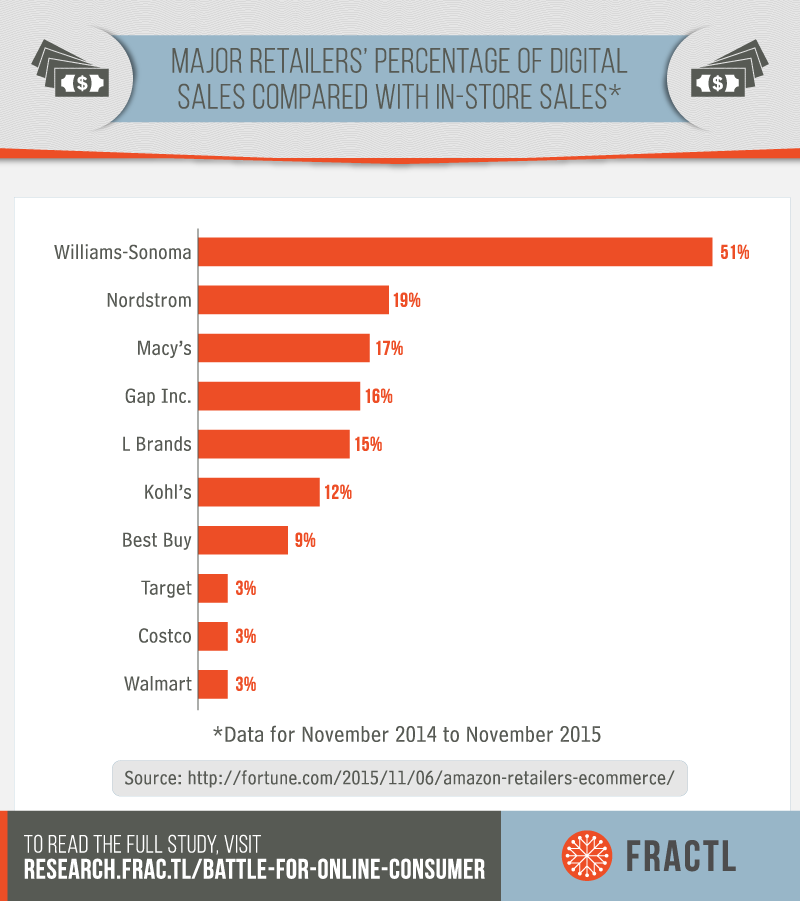
However, Amazon still dominates the e-commerce space despite the variety of options. Between November 2014 and November 2015, Amazon grossed $71.84 billion in online sales. This is more than Walmart, Apple, Macy’s, Home Depot, Best Buy, Costco, Nordstrom, Gap Inc., Target, Williams-Sonoma, Kohl’s, and Sears Holding combined. Big-box retailers are struggling to keep up with the king of online retail.
What can we learn from the marketing budget of Amazon and other top retailers? Does a media spend really matter – and will it attract consumers?
We looked at how 20 top online retailers (including online-only companies, such as Amazon and Etsy, as well as companies that had both brick-and-mortar and online operations) spent their marketing dollars in the past year.
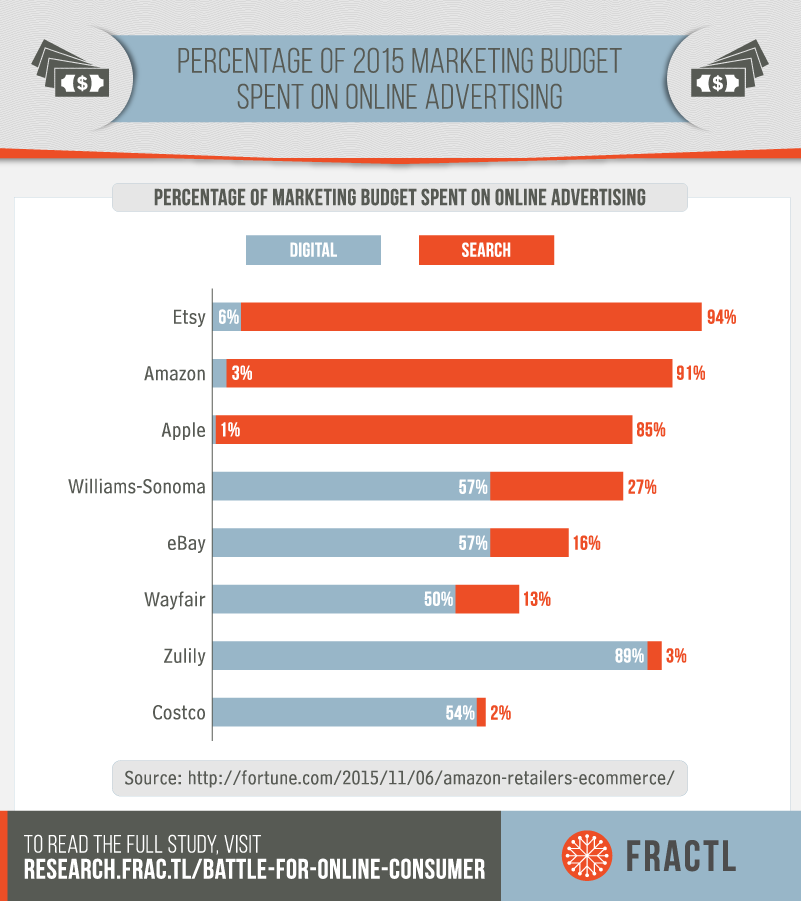
There was a lot of variation in how companies divvied up their marketing budgets. For instance, Home Depot and Kohl’s placed a huge emphasis on broadcast marketing, and CVS Pharmacy spent more than 50% of its marketing budget on print. On the other side of the spectrum, Amazon, Apple, Costco, eBay, Etsy, Wayfair, Williams-Sonoma, and Zulily all spent more than 50% on online advertising.
Of the companies that spent the majority of their marketing dollars on online advertising, there was a stark division in strategies. Amazon – the company with the tightest grip on online consumers – spent 91% of its total marketing budget on search (and only 3%) on digital advertising.
Like Amazon, Apple and Etsy both spent more than 85% on search and less than 6% on digital advertising. In contrast, Costco, eBay, Wayfair, Williams-Sonoma, and Zulily all spent more than 50% of their 2015 marketing budgets on digital advertising and less than 27% on search.
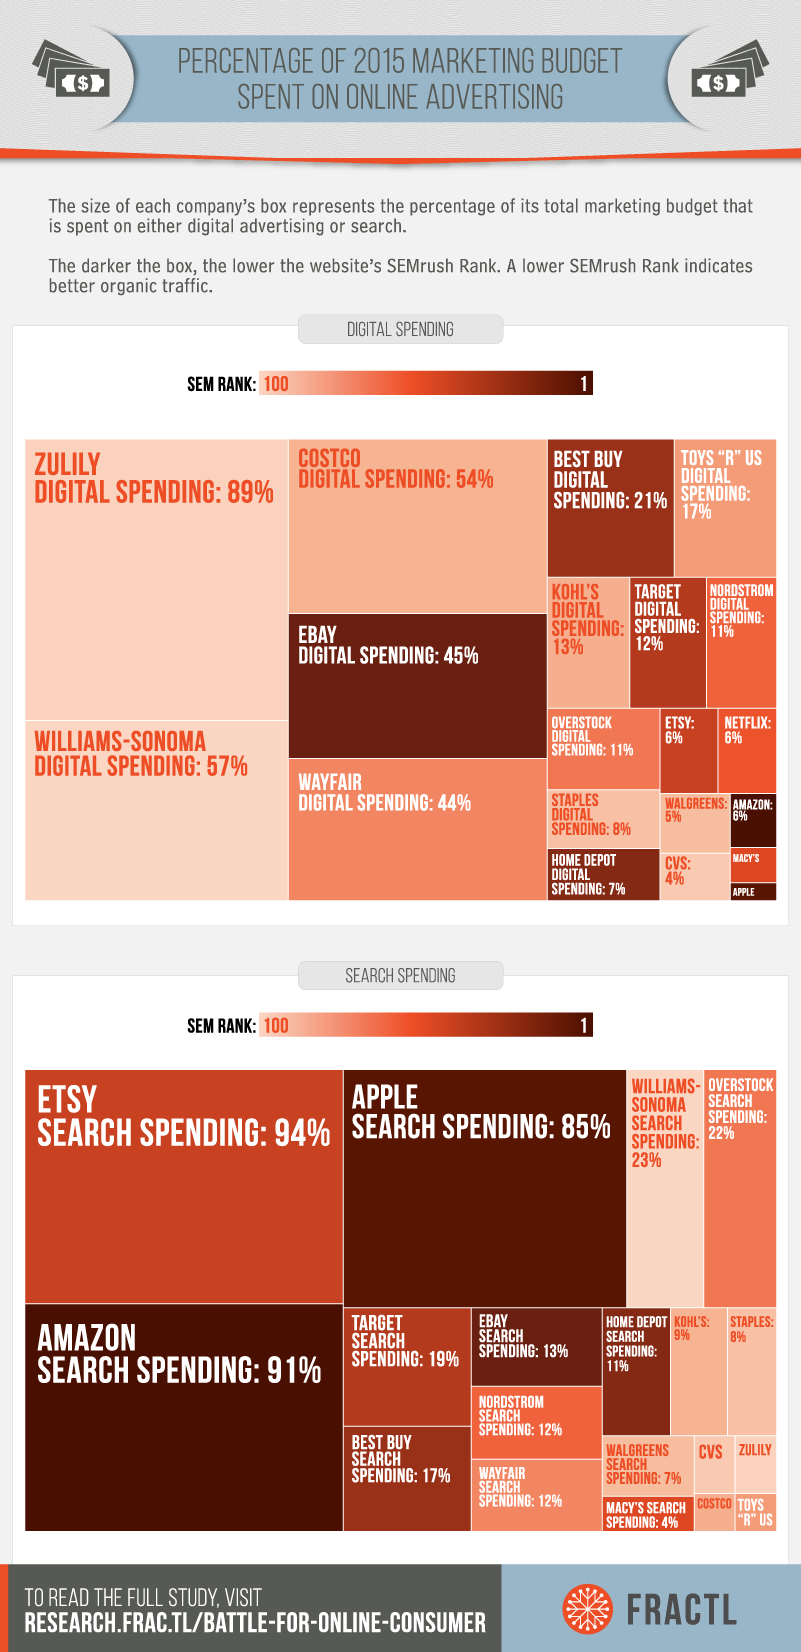
Interested in how these two disparate strategies were succeeding, we compared SEMrush Rank (which ranks websites according to organic traffic coming from Google’s top 100 organic search results) to the percentage of a company’s media spend devoted to either search or digital campaigns.
We found that percentage of marketing budget devoted to search campaigns was much more closely correlated with SEMrush Rank than digital spending, even when we ignore Amazon and Apple. In the chart below, the size of each company’s box is correlated with the percentage of their budget that they spend on either digital advertising or search advertising. The darker each of the boxes, the better their organic traffic.
Although many factors contribute to a company’s success or failure online, search spending is the chosen tactic of online-retail-giant Amazon. Search spending is also most closely tied to a company’s organic website traffic.
Methodology
We used The List to collect information about each company’s media spending. We used SEMrush to pull each the SEMrush Rank of each company’s website. The SEMrush Rank orders websites according to organic traffic coming from Google’s top 100 organic search results.
Sources


