Want to expand the reach of your content to a more global audience? Fractl conducted an analysis of 290 top-performing campaigns dating back to 2014, which resulted in over 4,000 international placements. The goal of this study was to determine what content attracts international publishers. Read on for an in-depth look at our findings.
I. Beyond Borders: Visualizing Global Content
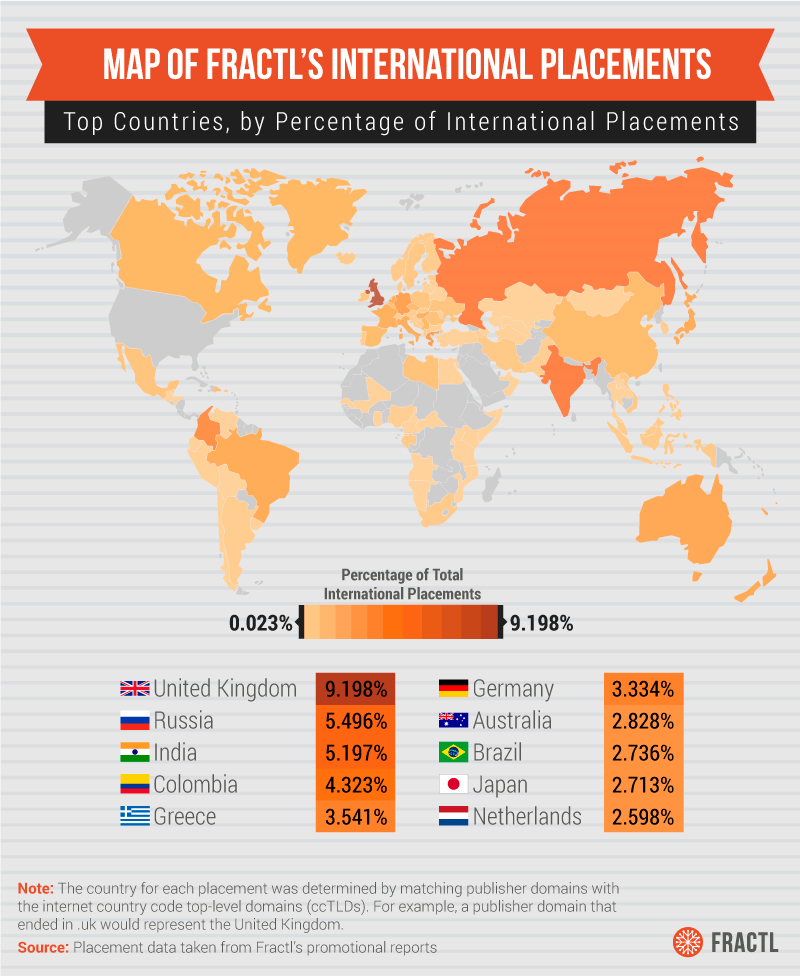
Fractl’s content has been featured in publications in over 130 countries. This map illustrates how modern content truly extends to all corners of the globe. Our biggest international success has come in the United Kingdom (chalk it up to similar culture and language); however, Russia and India are also among the countries that have frequently covered our campaigns.
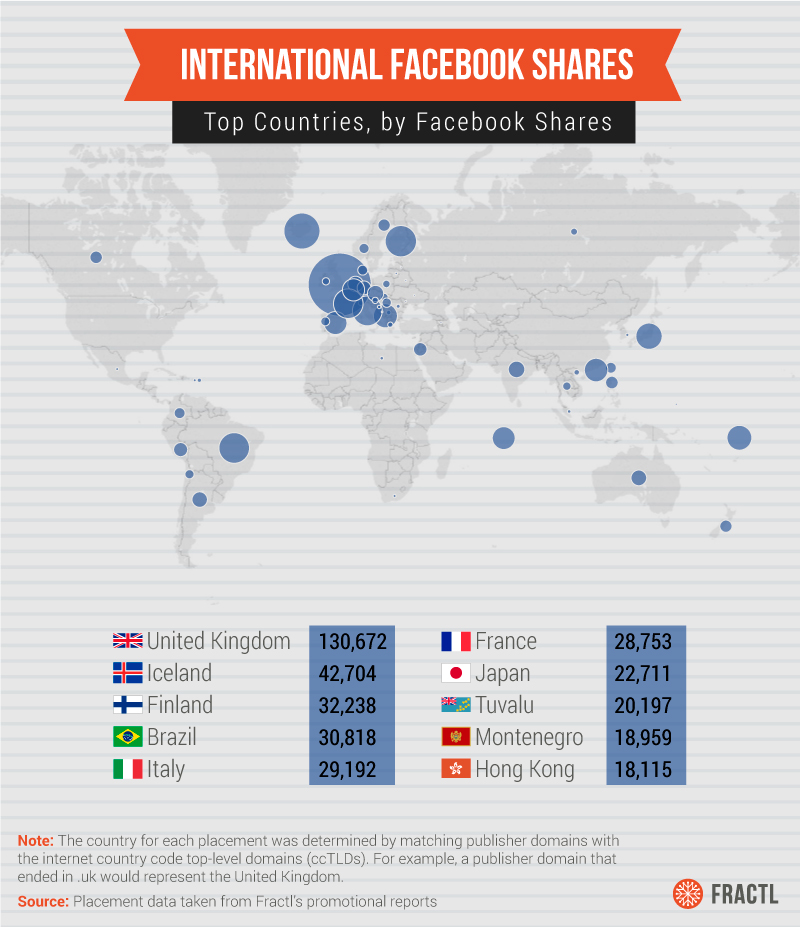
International placements also lead to shares on social media around the world. Fractl’s content has been shared over half a million times in other countries on Facebook alone. The map above depicts where people have been sharing our content globally.
II. What Content Verticals Are International Publishers Looking For?
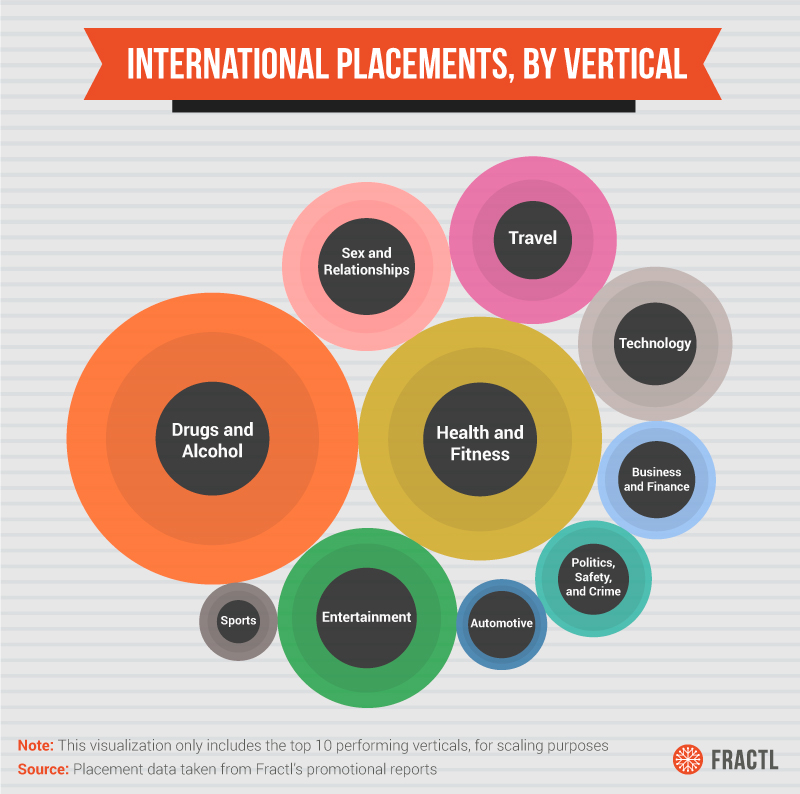
It can be difficult to predict what content types will resonate with publishers from other countries. However, certain verticals tend to perform better than others. The visualization above depicts the top 10 Fractl verticals for international placements. It’s worth noting how dominant the top six verticals are. While this data applies specifically to Fractl campaigns, content producers would do well to know which verticals are their top performers when pursuing international links.
“Drugs and Alcohol” is our top-performing international vertical because substance abuse and addiction is a global issue. Several of our campaigns under this banner incorporate data from multiple countries. Using data sources that include multiple countries can be a great starting point for those looking to increase placements globally.
For More International Press, Try Using Data Sources That Include Multiple Countries
A campaign Fractl produced for Recovery Brands, titled “Consumption by Country,” is an example of this principle in action. For this project, we analyzed current and historical rates of consumption since 1960 for alcohol, tobacco, and food to see the trends that have emerged over the decades.
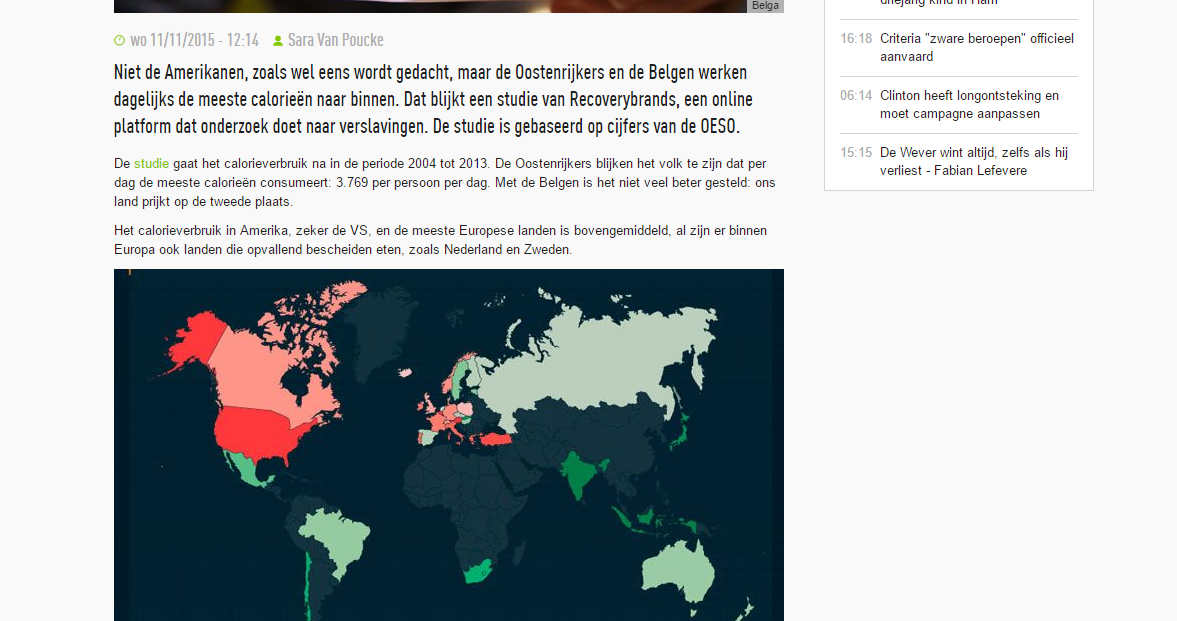
The project used statistics from the Organization for Economic Cooperation and Development (OECD) to determine the consumption rates by country, which allowed for a much broader focus than just the United States. This approach led to many more international placements, such as this one for a Belgian publication.
III. The Best Content Doesn’t Need a Passport
We discovered during our analysis that Fractl’s top 50 performing campaigns overall, including domestic placements, were also the 50 campaigns that earned the most international placements. This would suggest, at a basic level, a correlation between successful domestic content and successful international content.
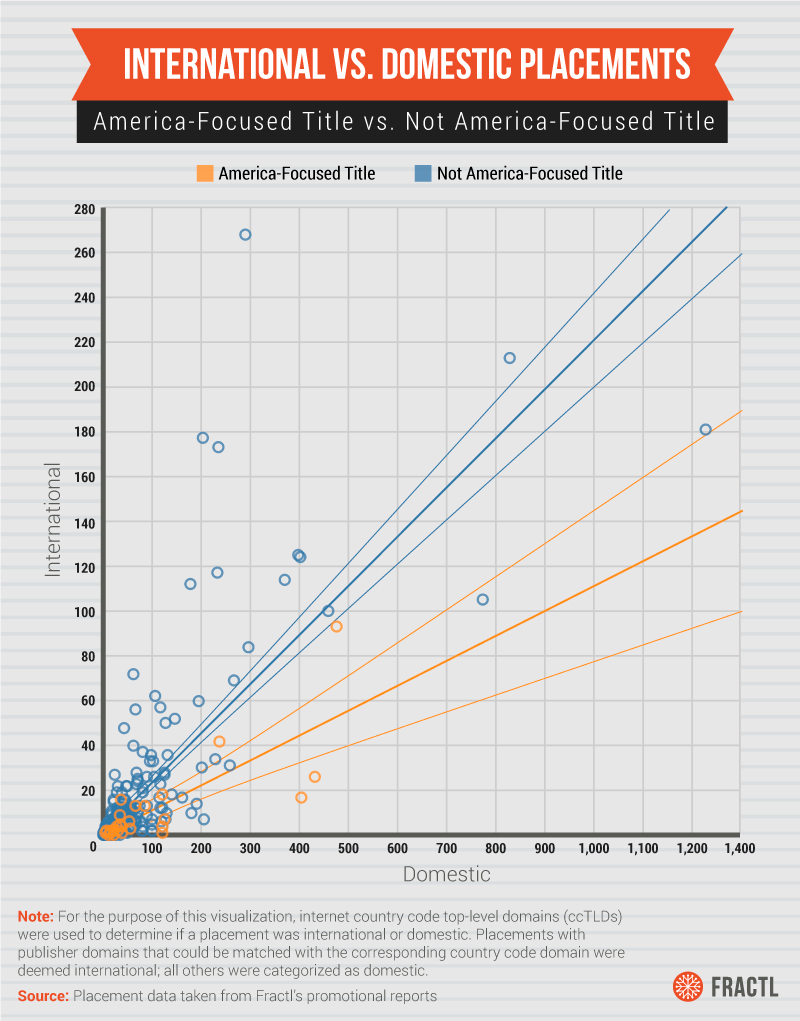
The graphic below looks at this relationship more closely. Specifically, we wanted to see if there was a correlation between domestic placements and international placements.
The trend lines on the graph indicate that there does appear to be some correlation between earning more placements domestically and earning more international placements.
The graphic also breaks the data into two separate categories. The orange markers and trend lines are for content with a title that is American-focused, such as “America’s Cleanest and Dirtiest States.” The blue markers and trend lines are for more generic titles that don’t specifically call out the U.S. This distinction becomes important as we look at the trajectory of the two categories. Clearly, content with a title that is U.S.-focused seems less likely to secure placements in other countries.
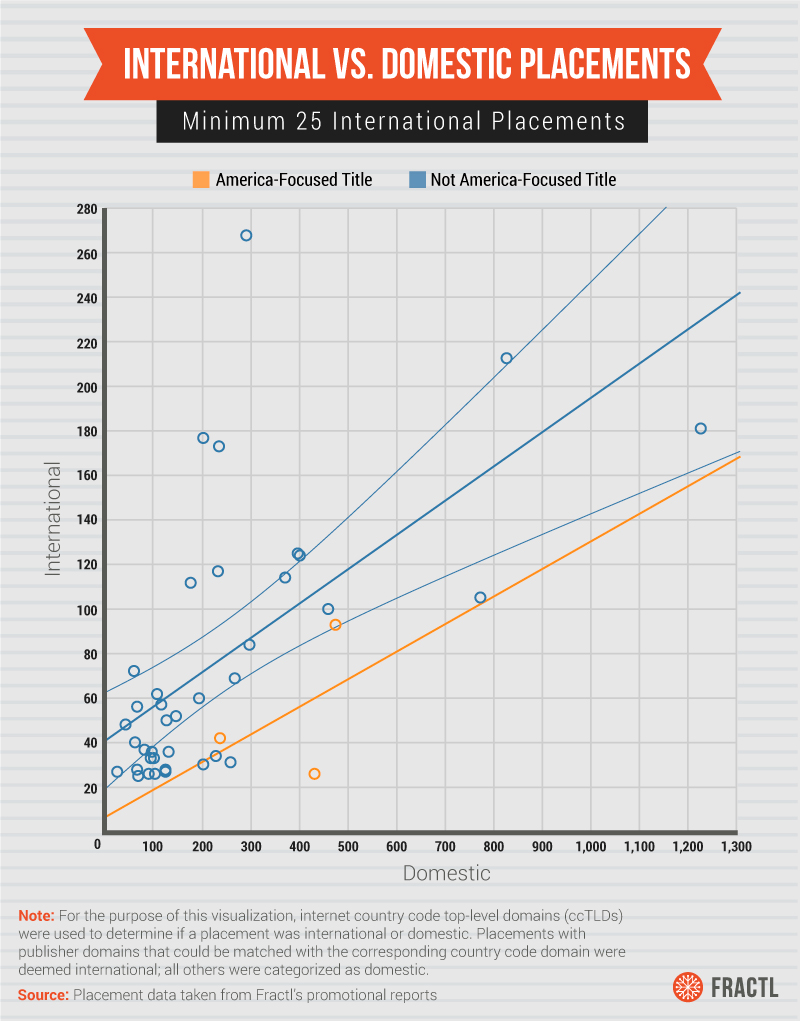
This trend appears to become stronger as we look only at campaigns that did well internationally, picking up at least 25 placements outside of the U.S. Only three campaigns with titles that specifically referred to the U.S. reached this goal.
Another pattern that emerges is that all of the campaigns that earned at least 25 international placements also earned at least 25 domestic placements – a minimum one-to-one ratio. The number of international placements begins to fluctuate once past 25 domestic placements, which can be dependent upon a number of factors. While securing 25 domestic placements doesn’t guarantee international success, domestic success plays an important role in driving international placements for Fractl’s campaigns.
Limiting Focus to U.S. May Restrict International Opportunities
The fact that only three of our campaigns with U.S.-focused titles passed 25 international placements suggests that these campaigns may be less attractive to international publishers. While many topics apply to people all around the world, when a project announces in its title that it is only applicable to one country, the appeal of that topic may be reduced.
An example of this can be seen in a recent campaign we produced for apartment listing site Adobo. The campaign was titled “Tolerance in America.” It was a controversial idea: We used Twitter data to pinpoint which states and cities had the highest concentration of prejudiced and tolerant tweets.
Bigotry and prejudice are not concepts just applicable only to the U.S. One doesn’t have to try hard to see evidence of this in other countries around the world. However, our campaign focused specifically on comparing states within the U.S., which, by design, excludes the majority of the world’s population from the analysis.
The campaign was quite successful domestically, earning over 400 placements, such as this one in a Louisiana newspaper. However, it only crossed the 25 international placement threshold by one placement.
Examples like this are an important reminder to alter content strategies based on the specific goals for that piece of content. While controversial content can be a great tool to use, it may be wise to broaden the focus to reach beyond the U.S. if the goal is to appeal to a more international audience.
IV. What Topics Are Most Compelling to Press Around the World?
While our analysis included over 4,000 international placements, an astonishing 70 percent of those valuable international pickups came from our top 50 performing campaigns. Clearly, publishers from around the world were most intrigued by what we were doing in those top-performing campaigns. We took a closer look at the composition of those campaigns to determine what exactly it was that grabbed headlines globally.
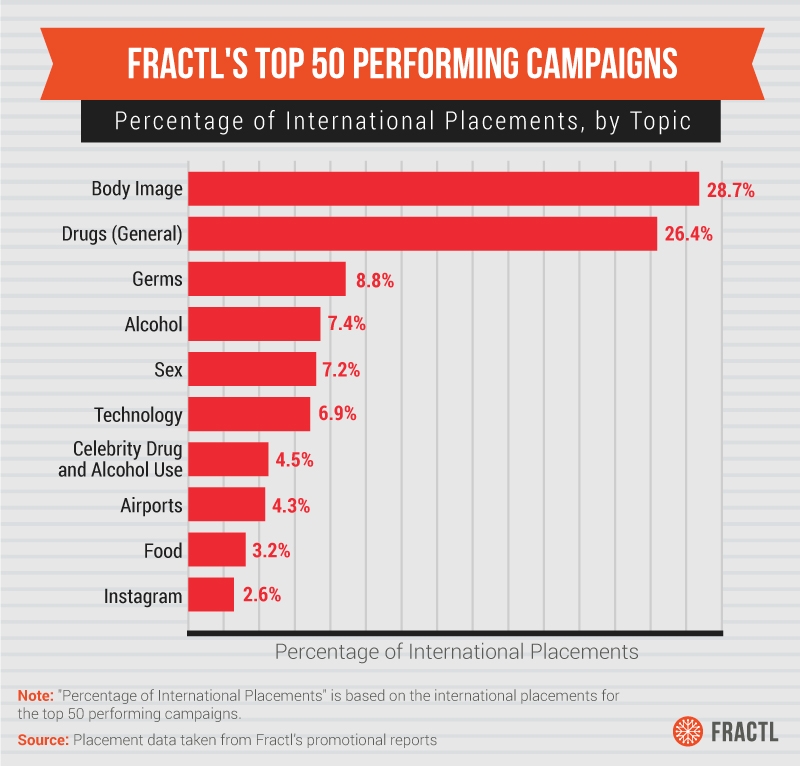
A high-level overview of which verticals perform well around the world is telling, but we took it a step further. We also looked at the specific topic each of our top 50 international campaigns tackled, which provided us with an even clearer picture of what type of content is most successful.
As you can see, we get a slightly different picture when we break down our campaigns by topic rather than just by vertical. The top 10 topics (according to international publishers) are represented in the graphic above. Body image is clearly the most popular topic.
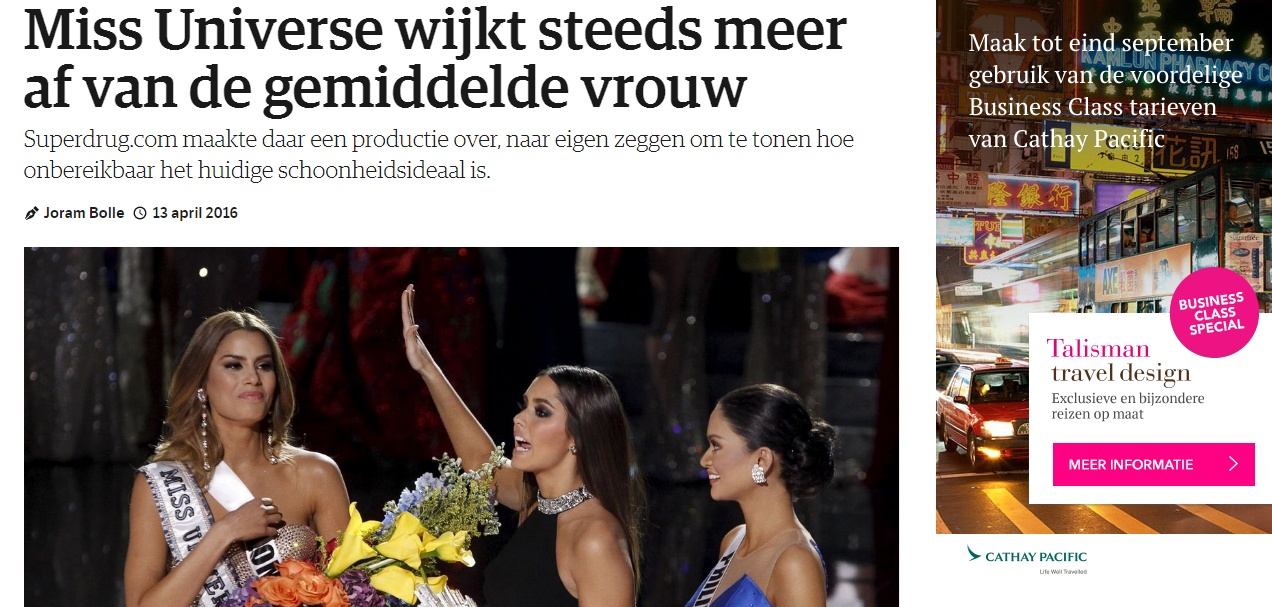
An example of an internationally successful campaign focused on body image is the “Evolution of Miss Universe” campaign, which Fractl produced for our client Superdrug Online Doctor. The concept for the project was simple: Fractl compared the images of Miss Universe winners going all the way back to 1952. The final project included a slider, where readers could easily slide through the images to see the changes over time, and a video morph that highlighted the changes in dramatic fashion.
The campaign was placed over 40 times internationally and earned over 140 total placements, including the below placement from a publication in the Netherlands.
Body image is an issue that affects men and women all around the world. In addition to being a universal topic, the images allow readers to understand the story without necessarily understanding the English language.
Splitting verticals into topics also allows us to pinpoint what topics are most successful within a vertical. By splitting the “Drugs and Alcohol” vertical by topic, we saw that campaigns focused on drugs attracted more international publishers than those focused on alcohol. With the “Sex and Relationships” vertical, our analysis revealed that international publishers were most attracted to campaigns like “Does Size Matter?” and “Sexual Exposure Calculator,” which Fractl produced for our client DrEd. Both of these campaigns focused on sex rather than other aspects of relationships.
The country that published the most stories about both of these campaigns was Greece, which had over 16 percent of the international placements. It is interesting that “Does Size Matter?” did so well there, considering Greece was not one of the countries included in the study.
V. How to Format Content to be Most Appealing to Publishers Around the World
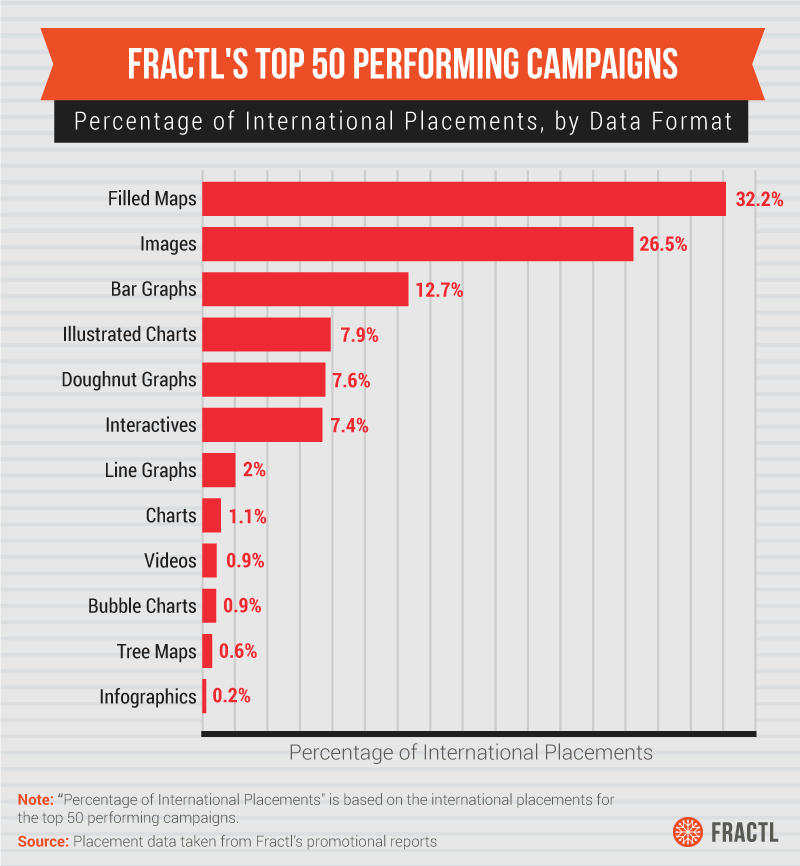
After deciding on a topic and conducting the appropriate research, content producers must determine the best format for representing their findings. While this is something that should be done on a project-by-project basis, our study did reveal some trends when it came to the format international publishers gravitated toward most frequently.
By a convincing margin, filled maps were preferred by most international publishers. Filled maps are great visual tools, as they can quickly highlight differences between regions and visually illustrate the scope of issues around the world.
Coming in second place was images. As mentioned before, images are a powerful storytelling medium and can instantly convey information in a way that cuts through language barriers.
Maps Allow International Publishers to Tell Their Own Stories
Our “Consumption by Country” campaign was a powerful example of filled maps being used to represent data in an impactful manner. Adding color to a filled map is a great way to highlight the contrast portrayed. Maps also have the capacity to instantly showcase different regions across the globe, making them a great tool for any marketer interested in more international placements.
Another powerful advantage to using filled maps is that it allows publishers to find their respective country, even if they aren’t specifically called out in a placement. This gives international publishers the freedom to tell their own stories, especially if they think their readers will find that content compelling.
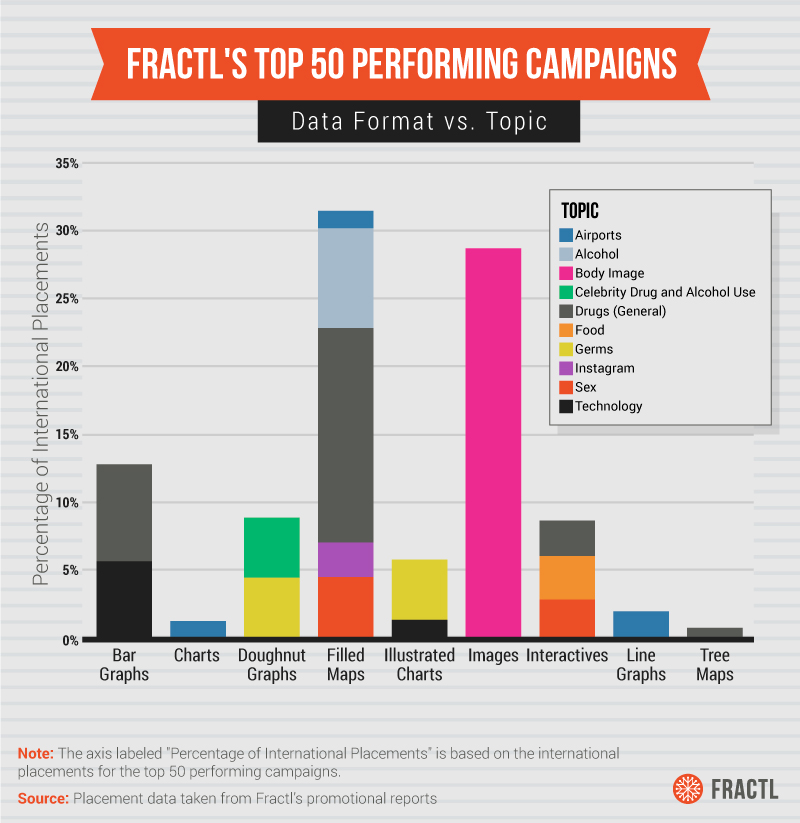
It’s important to know which formats are successful; some formats work better with certain topics. The visualization above illustrates this point. New insights come to light by looking at our top 10 performing international topics, combined with the visual format that was used.
We know from ranking our topics by international performance that body image was the most popular topic. However, we can see in this graph that body image was only associated with projects that used images. This makes perfect sense because photos and illustrations go hand in hand with conversations about body image. This data shows that by pairing the topic of body image with images, content producers can create powerful campaigns that are proven to attract interest around the world.
VI. Data Sources Matter to International Publishers
One of the most important decisions to make when producing content is what data source to use. If the data aren’t there, most times, neither is the story nor are the key takeaways from the analysis. It doesn’t matter how innovative or groundbreaking a topic or idea is if it can’t be proven. International publishers clearly have tendencies when it comes to what data sources they like to publish.
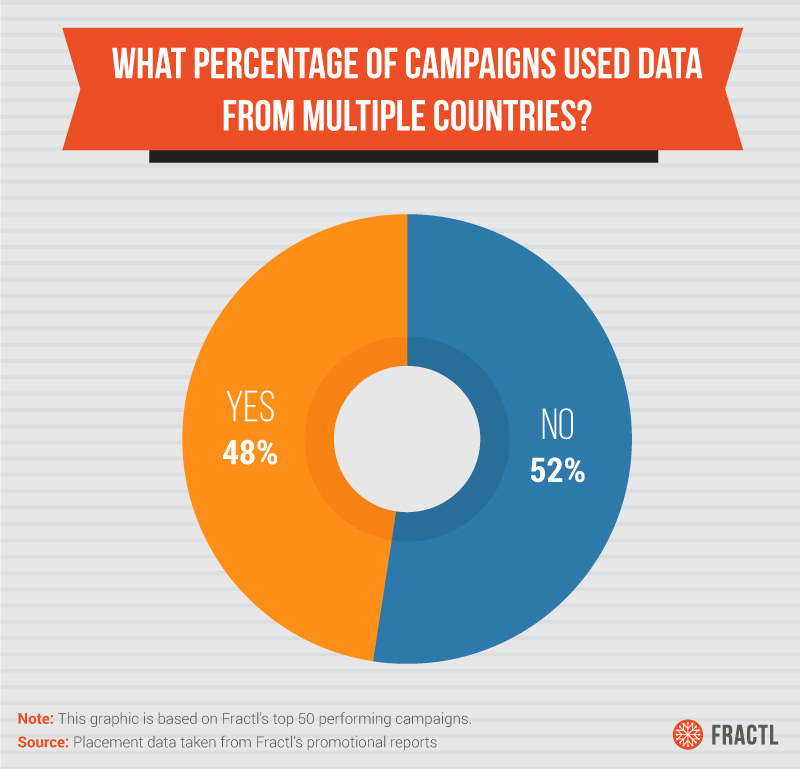
The first thing we looked at was whether or not the majority of these campaigns pulled data from multiple countries. It stands to reason that this would instantly make content more appealing to publishers outside of the U.S. However, more than half of our best-performing international content did not have a strategic, multi-national focus.
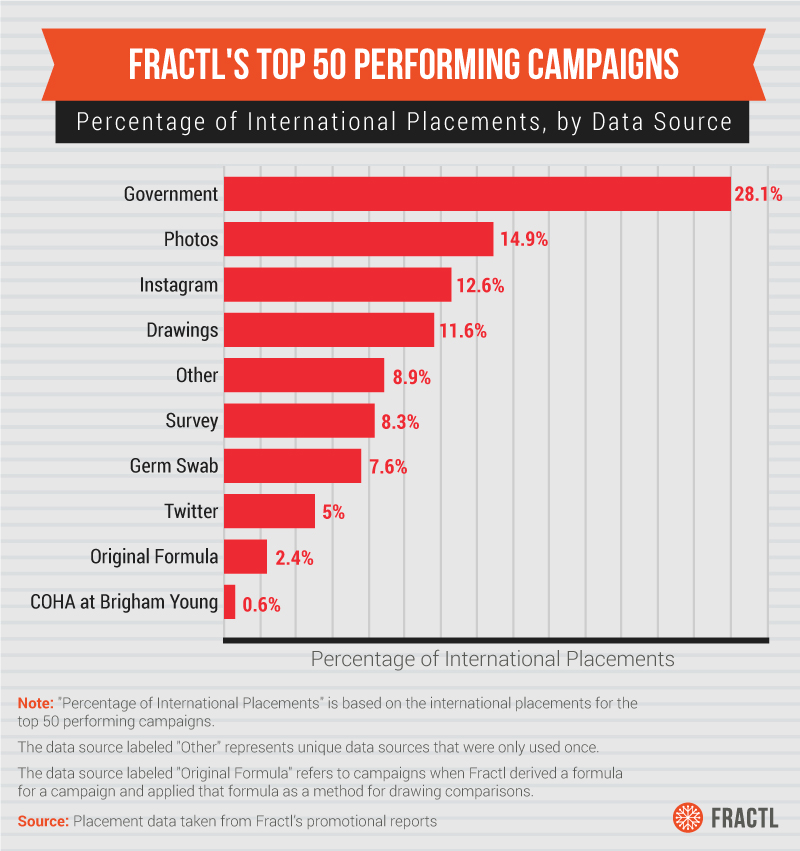
With the above graphic, we delved deeper into our analysis of how international publishers reacted to certain data sources. Overwhelmingly, the most popular data sources were official government sources. Most reputable publishers want to be sure that anything they publish comes from a credible source.
Use Visual Data to Appeal to International Readers
Photos came in as the second-most popular data source for press around the world. Fractl’s campaign produced for client Canva, “Average Faces of a Brand,” provides yet another example of how photos can be compiled to tell a compelling story.
This placement from a Brazilian publication is evidence of strong visual content cutting through the language barrier. Again, one doesn’t need to be proficient in English to see that the models all look alike in this campaign.
The demand for more visual content is further highlighted when one compares Twitter and Instagram campaigns. Instagram, a primarily visual medium, was the third-most popular data source for international publishers. By contrast, our campaigns that used Twitter as a source primarily focused on the words in the tweets themselves. Tellingly, Twitter data sources were the eighth-most popular sources.
Find What Works for Your Content
Based on our findings, there are many different paths to earning international placements. While using data from multiple countries is a great starting point, it is by no means a requirement – much of our best performing content didn’t adhere to that idea.
It is also worth noting that the results are what worked for Fractl campaigns. Depending on the goals and subject matter of your content, you may find that different sources, topics, or formats work better for what you are trying to accomplish.
Ultimately, a good rule of thumb is to focus on producing quality content that incorporates elements proven to drive views and shares. In our experience this is content that’s emotionally resonant, offers new or surprising information, appeals to a wide audience, and/or incorporates a geographic or pop culture angle. As mentioned before, the best content has a funny way of being picked up more frequently, even across international borders. While there were certain trends we noticed in our campaign analysis, there were also plenty of campaigns that didn’t follow these principles and earned valuable international coverage.
Want to see more examples of successful campaigns from a creative and innovative content marketing agency? Check out our portfolio for dozens of examples of content that captivated the web.
Methodology
For this campaign, Fractl analyzed 290 campaigns produced for clients, dating back to the year 2014. We used our promotional reports for these campaigns to look at how many placements each campaign received, and the unique URL for each placement.
The country for each placement was determined by matching publisher domains with the internet country code top-level domains (ccTLDs). For example, a publisher domain that ended in .uk would represent the United Kingdom. Publisher domains that could not be matched with a corresponding ccTLD were categorized as domestic.

