It’s safe to say that we are in information overload on the internet. Over 2 million blog posts are published every day. That’s a lot of content floating around the web.
With this much digital media going out into the world every day, it’s no surprise that it’s hard to get people to notice your content. It’s easy to blend into the noise and struggle to gain attention.
But luckily, there is a proven way to stand out from the content crowd and get noticed by the masses. It starts with data.
Why Should You Use Data for Content Marketing?
In a digital space with so much information, using data in your content marketing can help tell a story in a unique and interesting way. It stands out over the unoriginal or repetitive stories that we often see online.
Content that includes fresh ideas, statistics, and findings will reach more readers, gain more attention, and create stronger results for content marketing campaigns.
Audiences Read and Share It
Audiences want to see something they haven’t seen before. They crave original content and want to discover new ideas. So, content with original data is often heavily shared and consumed by readers, expanding the organic reach of your content and brand awareness.
Publishers Cover It
Interesting data is also appealing to publishers. We surveyed over 500 publishers and found that 39 percent said the perfect piece of content contains exclusive research. Providing publishers with the type of content they want will increase your chances of having high-authority websites share your story.
It Organically Boosts Visibility and SEO
When a piece of online content is widely shared, mentioned by high-authority blogs, and linked to by major publications, its visibility grows. The content is more likely to be found through social media and lists higher in search rankings.
Traditional Media Takes Notice
A compelling data story can even jump off the internet and land in traditional media as televised news. Many of Fractl’s data-driven content marketing campaigns have been covered on televised shows from the “Today” show to Fox News.
Audiences Opt-in for It
Exclusive data is typically considered “high-value” content, so audiences are often willing to offer information in exchange for access, making it great for whitepapers or other “gated” content.
Data is the secret sauce that turns average content into exceptional content that is organically promoted through both digital and traditional media. That leads us to the next question …
Where do you get this original data?
Where to Find Data Sources for Content Marketing Campaigns
Original data usually comes from one of three places:
- Internal Data: Many organizations have a plethora of original data already in their hands. This internal data is created through the operation of the organization and may include information on sales, customer habits, marketing intelligence, and internal research. Brands can pull from their own databases to retrieve this unique information.
- Firsthand External Data: External data comes from a source that is not connected to the organization. One way that brands can procure this data is through firsthand research. You can conduct surveys or research to find new data.
- Secondhand External Data: Another way to uncover data is by exploring existing secondhand research and data. With this approach, you use publicly available data that is sometimes difficult to discern to find interesting trends and statistics.
Let’s look at how some brands put these practices to work.
Internal Data Examples
Many large organizations have learned how to leverage their internal data to uncover interesting stories that generate brand awareness while highlighting their products, services, and values.
Zillow Pulls From its Massive Database on Housing Trends
Zillow, an online real estate and rental marketplace, has data on over 110 million homes in its database. From home prices and estimates to stats on square footage and in-home amenities, Zillow has a deep pool of data at its disposal.
It learned to leverage this abundance of information by creating data-driven campaigns that are interesting to its target audience and helpful for spreading general awareness about its brand.
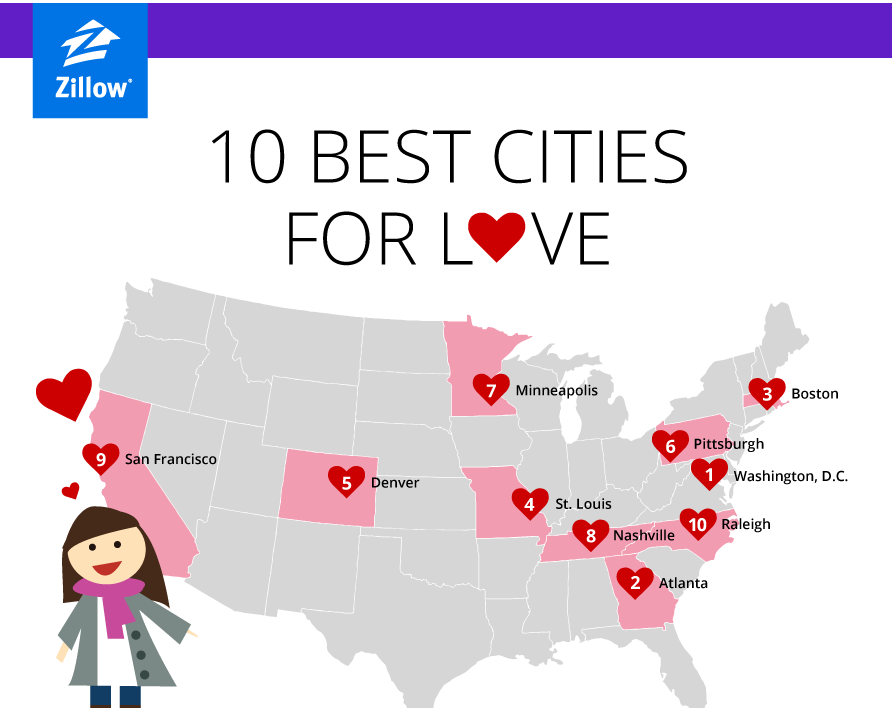
Its Mortgage Rate Graph, which is regularly updated, helps its target audience find answers during their purchasing process. It also publishes campaigns like “10 Best Cities for Love” on its Market Trends page to gain the attention of a larger, broader audience.
Zillow even took its data to the next level by publishing a book that pulls stats and knowledge from its database: “Zillow Talk: The New Rules of Real Estate.”
Kaspersky’s User Data Provides a Look at Cyberthreats Around the World
Kaspersky, an antivirus and internet security software provider, protects more than 400 million users across 200 countries. This large and wide user base provides Kaspersky with an incredibly deep look into the trends of digital security.
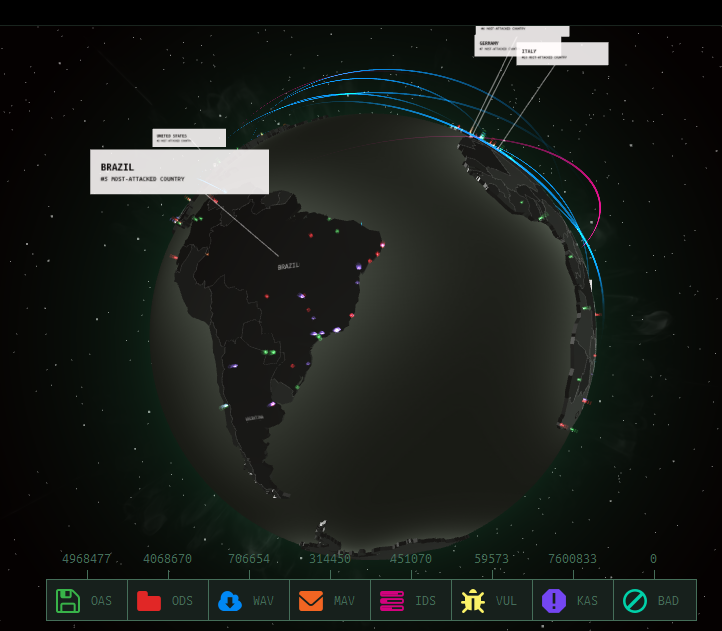
The company turned this data on cyberthreats occurring across the world into a real-time, interactive map that shows audiences where threats such as viruses, network intrusions, and spam are occurring.
The Cyberthreat Real-Time Map is fun to use while highlighting Kaspersky’s bigger brand message – cyberthreats are out there, and you need protection.
Kaspersky has so much data that it also uses it to create infographics and to serve as the topic for many of its blog posts on The Kaspersky Lab Daily.
Allstate Uses Accident Reports to Expose Hazard Trends
From claim costs to locations of incidents, the Allstate database is full of stats and information on accidents around the country.
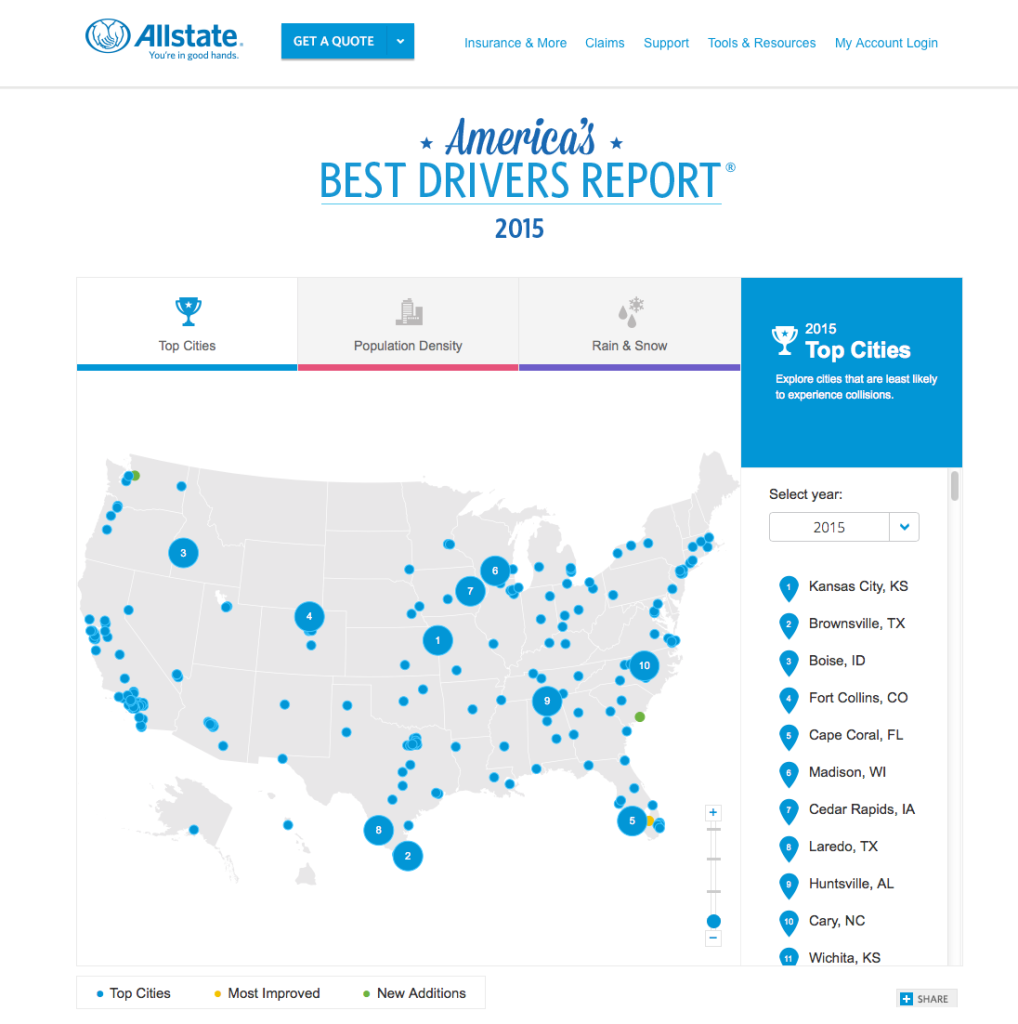
Allstate pulls from this data to find trends such as the information in its “America’s Best Drivers Report,” which explains where the best and worst drivers in the country are located.
The insurance company also uses its data to highlight dangers to help improve safety on the road and in the home. They publish infographics with original data on holiday home hazards, teen safe driving, and distracted driving, among other reports that appear on the infographic section of its blog.
Firsthand External Data Examples
When brands don’t have a deep pool of data at their disposal, that doesn’t mean they are out of luck. They can create data-driven campaigns by doing their own research.
Fractl works with our clients to create interesting datasets to use for their content campaigns. We uncover new insights by doing firsthand research, such as conducting surveys to collect data and then analyzing the data to find patterns that tell an interesting story.
Here are a few examples of campaigns we launched for our clients using firsthand external data.
DIRECTV Catches National Attention for Study on Lies
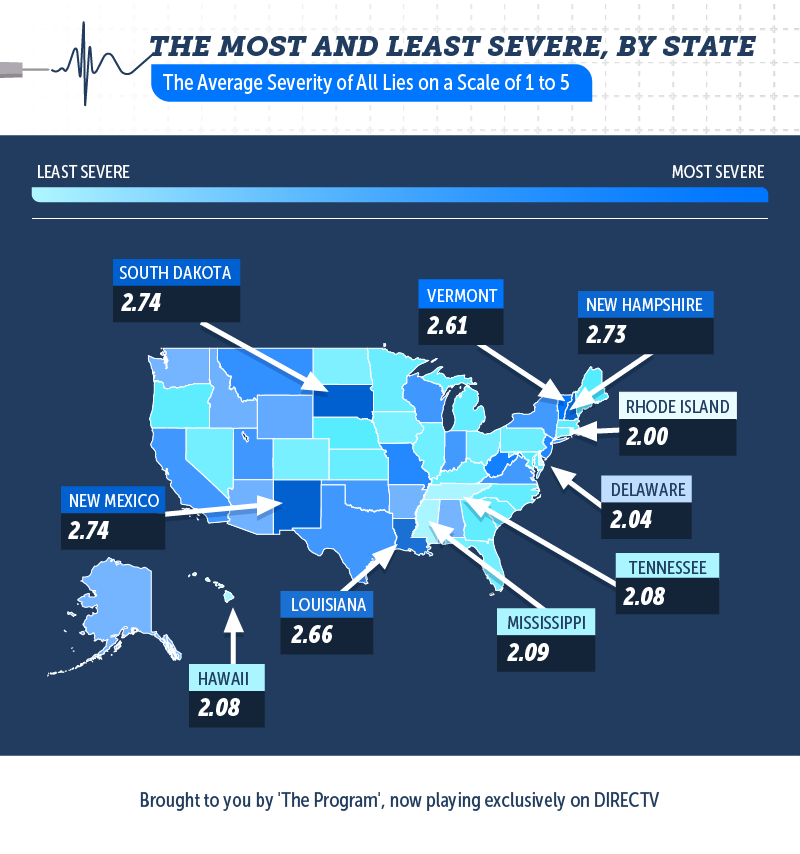
When DIRECTV wanted to boost awareness for its movie about Lance Armstrong and his deception in the world of competitive cycling, they came to us. We decided to take a different approach to the promotion. Instead of focusing on Armstrong, we focused on the root of his story: lying.
We surveyed 2,000 people to find out how often they lie, who they lie to, and what lies they tell. We put our findings in a full report that included charts and graphics depicting the data. The “White Lies: Where Is the Line?” study succeeded in getting attention from audiences, publishers, and even television programming.
The campaign was featured on The Huffington Post, and the “Today” show used the report as the basis for their segment on What’s Trending Now, giving the campaign nationwide exposure to a mass audience.
Travelmath Collects Data to Expose Hygiene Problems in Hotels
Travelmath is all about the data. The online trip calculator shares data on everything from travel distance and time to latitude and longitude points.
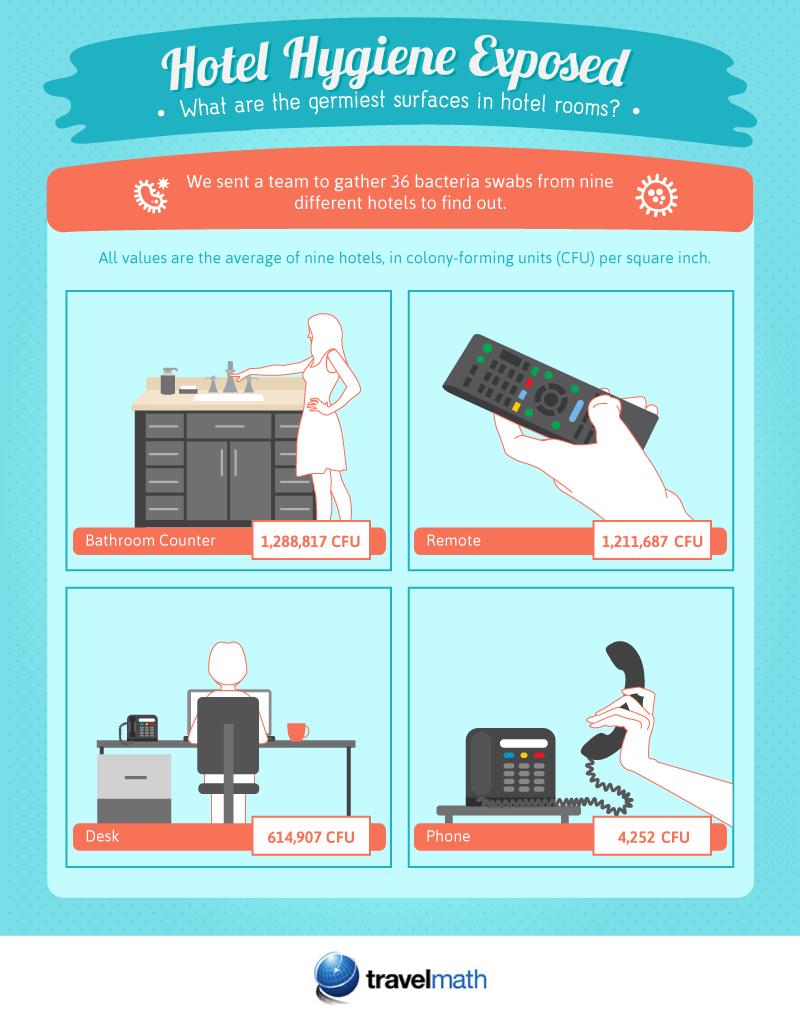
But when it wanted to create a content marketing campaign to increase awareness about its brand, it went outside of its database to collect information. Travelmath worked with Fractl to create the campaign “Hotel Hygiene Exposed.”
We collected and tested samples from nine hotels to uncover the germiest surfaces in hotel rooms and then sent the samples out for lab testing.
The topic and research resonated with both audiences and publishers. The study was mentioned in 700+ publisher features and featured on Yahoo.com, giving Travelmath the brand push it desired.
Secondhand External Data Examples
If data isn’t available in an organization’s internal resources or you can’t perform your own research to find interesting information, you have another option.
You can pull from public sources of existing data from places like Google Datasets Search, Social Media APIs, U.S. Census Bureau, BuzzSumo, and CIA World Factbook to find interesting datasets, many that are available for free.
Fractl frequently taps into these data sources to find unique stories for our client campaigns. Here are two examples.
Instagram Provides Data on Music Festival Trends for Recovery Brands
Over the last several years, we’ve created many data-backed campaigns designed to achieve mass visibility for our long-time client Recovery Brands.
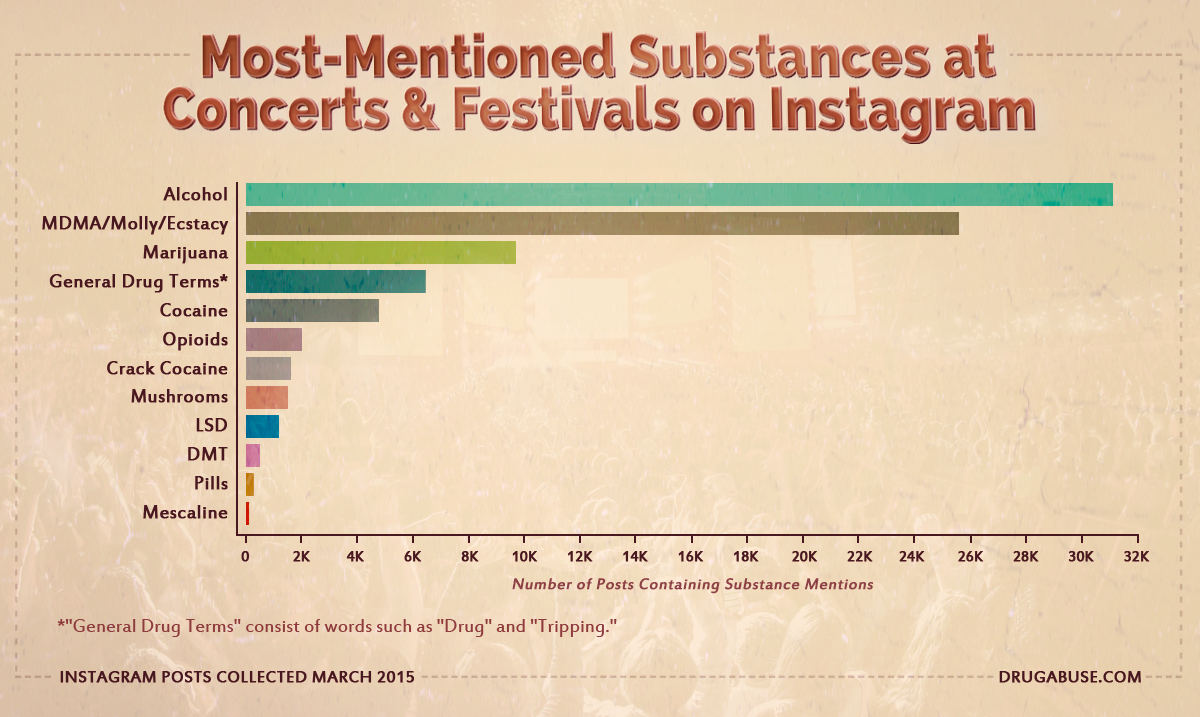
For this campaign, instead of pulling the client’s data or collecting our own data, we pulled from an existing resource. We used the Instagram API to scrape over 3.6 million posts that mentioned popular concerts and festivals.
We then calculated the percentage of posts that mentioned intoxicating substances like “alcohol,” “marijuana,” and “ecstasy” to create the campaign “Instagram, Drugs, and Rock ’n’ Roll.” The campaign showed the correlation between substance use and concert attendance.
By culling existing public data and using it to tell an interesting story that would appeal to a mass audience, we were able to increase the brand exposure for Recovery Brands while spreading its larger message about substance abuse. The campaign was featured on Mashable and covered by over 1,800 other websites
Fractl and Moz Analyze Public Job Postings to Connect With a Target Audience
Pulling data from existing secondhand sources is so powerful that we have even used it for our own campaigns.
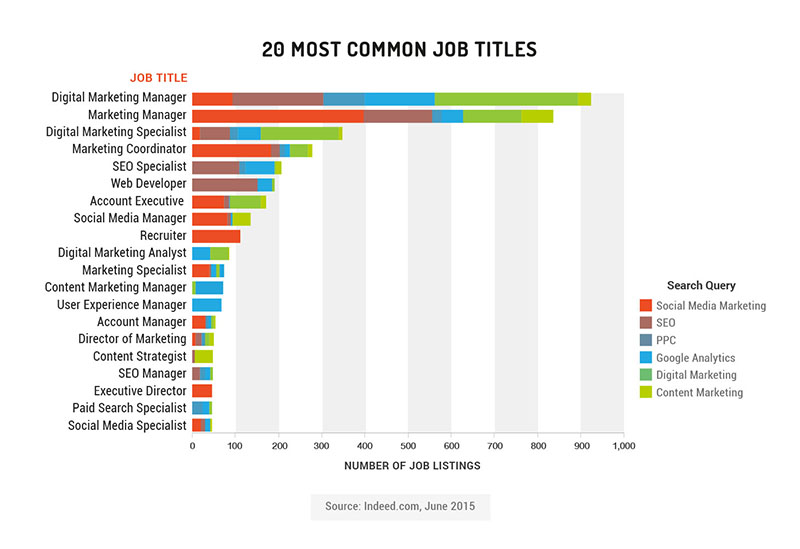
To catch attention in the inbound marketing community, we teamed up with Moz and pulled data from over 75,000 job listings on Indeed to produce a report on “The Inbound Marketing Economy.”
The report looked at trends in marketing job titles, salaries, and job growth – a topic that is important to our target audience of marketing professionals.
We turned public data into an interesting look at the life of our target audience, showing how you can leverage secondhand research to find data that fits your audience and goals.
In a world of content overload and overexposure, data is the secret ingredient that can help a piece of content stand out from the millions of other articles online.
Whether the data is pulled from a brand’s own pool of information or collected through firsthand research or secondhand databases, it can be used to tell a unique, original story that catches the attention of readers, publishers, search engines, and even traditional news outlets.
Want to see more examples of how original research and data can improve your content marketing efforts? Check out our library of thought-provoking proprietary research reports.

